The most miserable borough in London?

What was claimed
London's most miserable boroughs revealed to be Greenwich and Lambeth. Redbridge was ranked happiest.
Our verdict
Don't send flowers yet. The order is right but the difference between the happiness levels in these boroughs, and Redbridge at the top of the scale, is minimal. On average people across all London boroughs rate their happiness at around seven or eight out of 10.
“London's most miserable boroughs revealed to be Greenwich and Lambeth… Redbridge was ranked the happiest borough to live in.”
Evening Standard, 28 September 2016
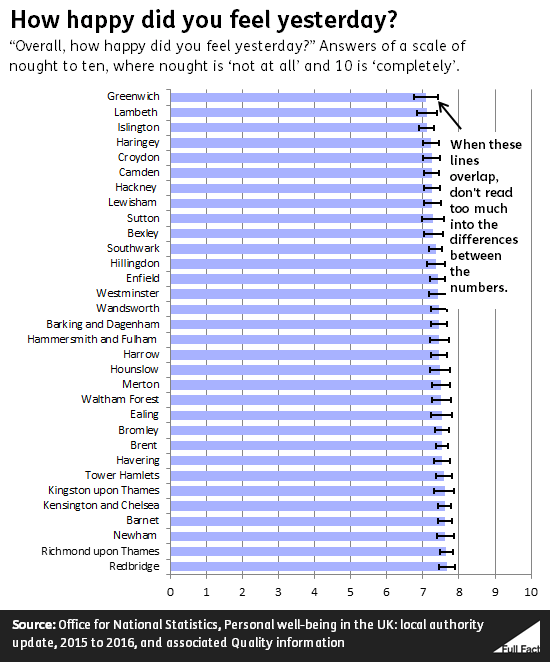
This is what the Office for National Statistics says, after asking people to rate their happiness on a scale of nought to ten. But the difference between the happiest and saddest borough is only 0.59 out of ten.
Besides the fact that the difference is pretty small, the survey isn't sensitive enough for these small differences between London boroughs to mean very much.
The statisticians warn: “Comparisons between areas should be done so with caution as these estimates are provided from a sample survey. Confidence intervals should be taken into account when assessing differences.”
When, as in Greenwich, a survey only asks 320 people for their opinion, it's impossible to have a precise result.
Although the estimate is that average happiness is 7.08 out of ten, statisticians are only really confident that the true estimate is somewhere between 6.74 and 7.41.
That means they are pretty confident that Redbridge is happier than Greenwich, which they put somewhere between 7.45 and 7.89 out of ten.
But for most boroughs these confidence intervals overlap and, as the ONS puts it "true differences may not exist."
Looking around the country, there are bigger differences.
Congratulations to Na h-Eileanan Siar (the Outer Hebrides), the happiest of us at 8.24 out of ten.
Join 74,000 newsletter subscribers who trust us to check the facts
Sign up to get weekly updates on politics, immigration, health and more.
Subscribe to weekly email newsletters from Full Fact for updates on politics, immigration, health and more. Our fact checks are free to read but not to produce, so you will also get occasional emails about fundraising and other ways you can help. You can unsubscribe at any time. For more information about how we use your data see our Privacy Policy.
Better luck next time to East Northamptonshire, the stragglers in this year's competition, who are at 7.01 out of ten.
You can explore the data for your area with interactive maps in the ONS release.
Hat-tip to Ben Page for spotting this story. Tweet us @FullFact with your tip offs.
Was this helpful?
Full Fact fights for good, reliable information in the media, online, and in politics.